Let’s jump to conclusions. For one minute, let’s be Yankee fans and make ridiculous assertions about how every player who dons our uniform will one have a plaque in Cooperstown.
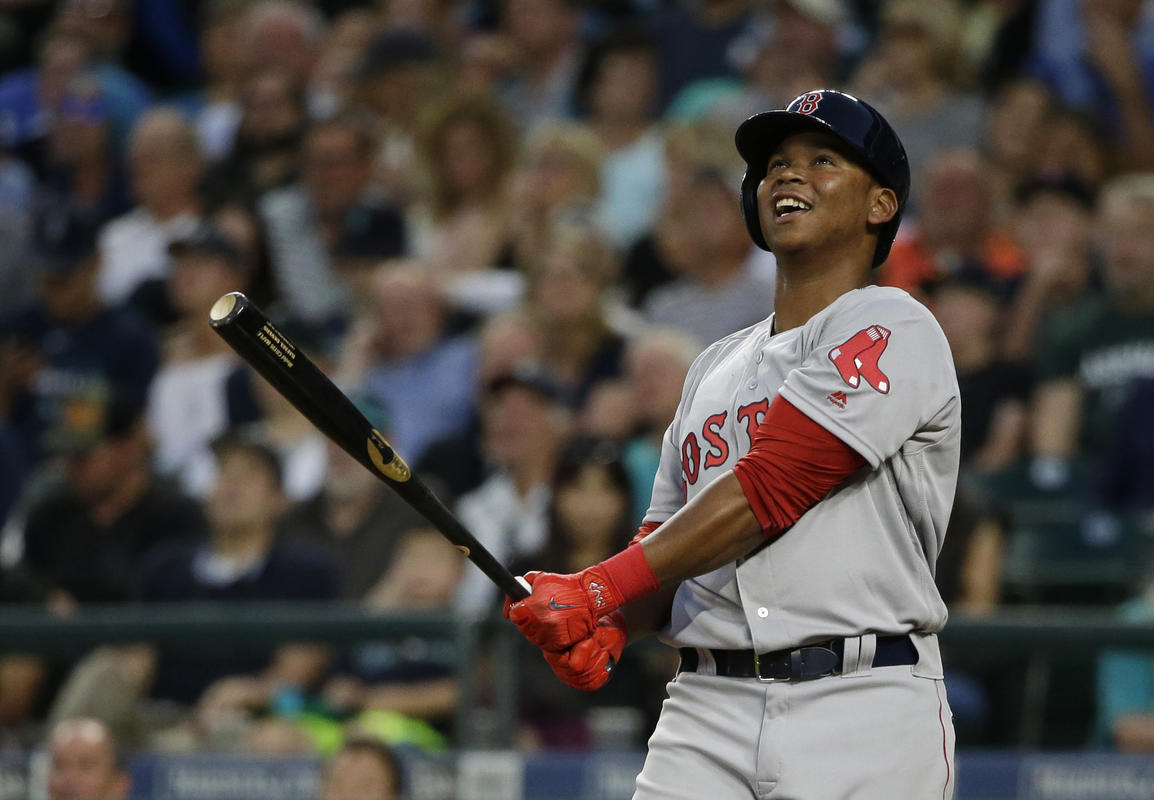
Rafael Devers is that guy. His electric start, along with the addition of a scalding-hot Eduardo Nunez, injected energy and offense into the struggling Sox in July and vaulted them back into first place in the East. Even after a recent dip, his .300/8/18 start to his big league career is more than just promising, it’s exhilarating. Let’s face it, if he played in the Bronx they’d already be thinking about retiring his number and ordering his plaque for Monument Valley. God knows they’re already measuring Aaron Judge for a HoF jacket.
But we’re not Yankee fans. Thank the Lord.
We’re smart enough to know that as good as Devers was on the farm, and what he displayed with his hot start, he will level out – in fact he may already have. But when he does, what can we expect? From an offensive standpoint, the answer looks pretty damn good.
Lies, Damn Lies, and Statistics
Bill James didn’t reinvent the game with his Baseball Abstract in 1977, but he did start a revolution in how we think about, analyze, and project player value. Johan Hill showed Brad Pitt the power of data analytics in Moneyball, and if he could figure it out between adopting half the world’s orphans and murdering zombies then most of us can too.
Many believers in sabermetrics will tell you that the number-one predictor of hitting potential in the big leagues over time is best summed up as the relationship between power, average, and strike-outs. Intuitively, when we think about the greatest hitters who ever played the game, we think about guys who drove the ball with power and seldom swung and missed. Williams, Ruth, Mays, and Aaron come to mind.
It’s not enough to simply crush the ball. Nobody in their right minds considers Dave Kingman one of the all-time great hitters – though he did hit 442 HRs in the pre-steroid era. Kingman’s problem? He was a career .236 hitter with more than 1,800 Ks. So, the greatest hitters who ever lived are those with high slugging percentages, high batting averages, and low strike-outs. Not exactly rocket science. If you isolate hitting for power (slugging avg – batting avg) and divide by Ks per 9-innings, you can begin to see quantitatively why the people you think were great hitters were, and why we hate Carl Crawford .
| Name | Level | Games | Slugging | Average | ISO-Power | SOs | SO per 9 Inning | ISO-P/K |
| Ted Williams | MLB | 2292 | 0.634 | 0.344 | 0.290 | 709 | 0.309 | 0.937 |
| Rogers Hornsby | MLB | 2259 | 0.577 | 0.358 | 0.219 | 679 | 0.301 | 0.729 |
| Babe Ruth | MLB | 2503 | 0.690 | 0.342 | 0.348 | 1330 | 0.531 | 0.655 |
| Hank Aaron | MLB | 3298 | 0.555 | 0.305 | 0.250 | 1383 | 0.419 | 0.596 |
| George Brett | MLB | 2707 | 0.487 | 0.305 | 0.182 | 908 | 0.335 | 0.543 |
| Willie Mays | MLB | 2992 | 0.557 | 0.302 | 0.255 | 1526 | 0.510 | 0.500 |
| Gary Sheffield | MLB | 2576 | 0.514 | 0.292 | 0.222 | 1171 | 0.455 | 0.488 |
| Wade Boggs | MLB | 2440 | 0.443 | 0.328 | 0.115 | 745 | 0.305 | 0.377 |
| David Ortiz | MLB | 2408 | 0.552 | 0.286 | 0.266 | 1750 | 0.727 | 0.366 |
| Manny Ramirez | MLB | 2302 | 0.585 | 0.312 | 0.273 | 1813 | 0.788 | 0.347 |
| Mark Texiera | MLB | 1862 | 0.509 | 0.268 | 0.241 | 1441 | 0.774 | 0.311 |
| Dwight Evans | MLB | 2606 | 0.470 | 0.272 | 0.198 | 1697 | 0.651 | 0.304 |
| Jack Clark | MLB | 1994 | 0.476 | 0.267 | 0.209 | 1441 | 0.723 | 0.289 |
| Jim Thome | MLB | 2543 | 0.554 | 0.276 | 0.278 | 2548 | 1.002 | 0.277 |
| Dave Kingman | MLB | 1941 | 0.478 | 0.236 | 0.242 | 1816 | 0.936 | 0.259 |
| Reggie Jackson | MLB | 2820 | 0.490 | 0.262 | 0.228 | 2597 | 0.921 | 0.248 |
| Carl Crawford | MLB | 1716 | 0.435 | 0.290 | 0.145 | 1067 | 0.622 | 0.233 |
| Wily Mo Pena | MLB | 599 | 0.445 | 0.250 | 0.195 | 559 | 0.933 | 0.209 |
Of the players who belong to the Hall of Fame (bold), Reggie Jackson was an outlier. Objectively speaking, from a quantitative standpoint, he was a painfully average ballplayer. For perspective, in more than 1,000 fewer at bats, he struck out 1,071 more times than Willie Mays. Reggie just happened to excel on the big stage – winning four World Series and winning MVP in two of them.
Boston’s Future
Rafael Devers hasn’t had enough MLB at-bats to generate a sufficiently large statistical sample yet. But if we compare his minor league numbers to Betts, Bogaerts, and Bradley – and knowing how those players have leveled out after over 450-MLB games each – we can begin to see where he might level out himself.
| Name | Level | Games | Slugging | Average | ISO-Power | SOs | SO per 9 Inning | ISO-P/K |
| Mookie Betts | Minors | 313 | 0.442 | 0.307 | 0.135 | 147 | 0.470 | 0.287 |
| Rafael Devers | Minors | 399 | 0.482 | 0.296 | 0.186 | 291 | 0.729 | 0.255 |
| Rafael Devers | MLB | 40 | 0.513 | 0.300 | 0.213 | 39 | 0.975 | 0.218 |
| Xander Bogaerts | Minors | 315 | 0.503 | 0.288 | 0.215 | 272 | 0.863 | 0.249 |
| Jackie Bradley | Minors | 277 | 0.474 | 0.298 | 0.176 | 208 | 0.751 | 0.234 |
We should note that currently, through 493 MLB games, Mookie’s ISO-P/K is .355 – placing him squarely between Manny Ramirez and David Ortiz. I hope we can agree that he’s leveled out quite nicely. It would be premature, with such a small sample at the big-league level, to project Devers will be in Betts’ class as a pro (he’s at .218 now. But with good coaching, line-up protection, and patience at the plate,. we can expect him to be more productive than either Bogaerts or Bradley – and that’s not too shabby.
And just for perspective – NY’s newest hero, Aaron Judge, had a .182 in 348 minor league games. And despite all the tape measure HRs and Sportscenter fawning, he’s sitting at .202 through 152 big-league games. Dave Kingman? He’s not even Carl Crawford.
Note: all statistics thank to the tome of wisdom at www.baseball-reference.com